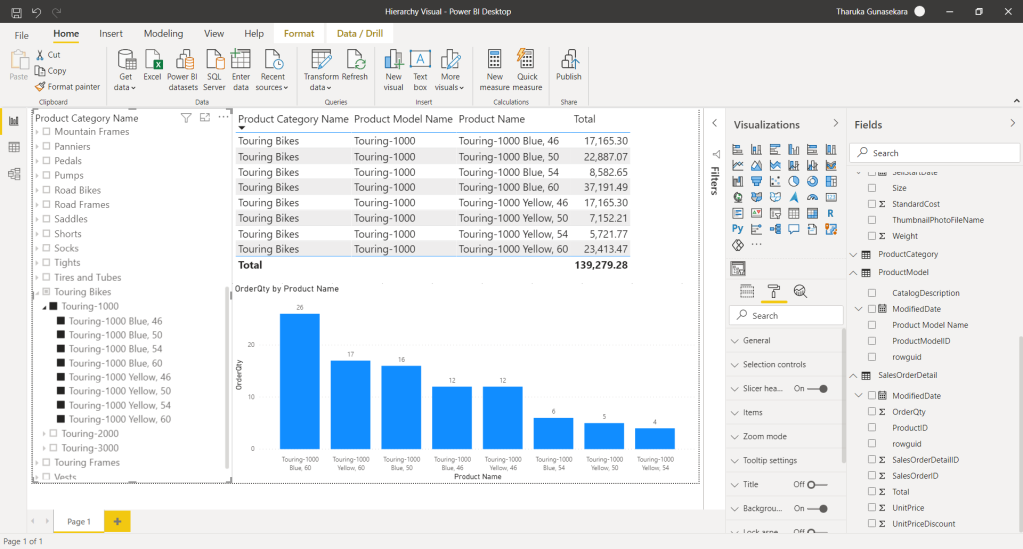
This blog provides the steps on how to add a Hierarchy Slicer which acts as a filter for a hierarchical structure of visuals in a Power BI report. This can be used to filter the report for a category instead of a certain value and its related data. The below figure displays this scenario.
Figure 1: Filters only for the particular row
If you want to how this hierarchy is created, please refer this blog. The data source used, is AdevntureWorksLT2012 database.
Step 01
Click on Get More Visuals option which is the 3 dots icon available under the Visualization pane.
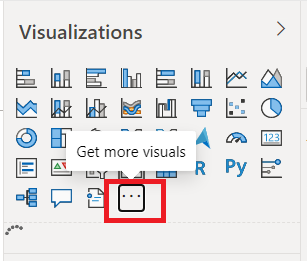
Figure 2: Click on Get More Visuals
If you have not signed-in your Power BI Account, the below pop-up will come and then sign-in to your account. Enter your email address and password.
Figure 3: Power BI Account Sign in window
Figure 4: Enter password and click on Sign in
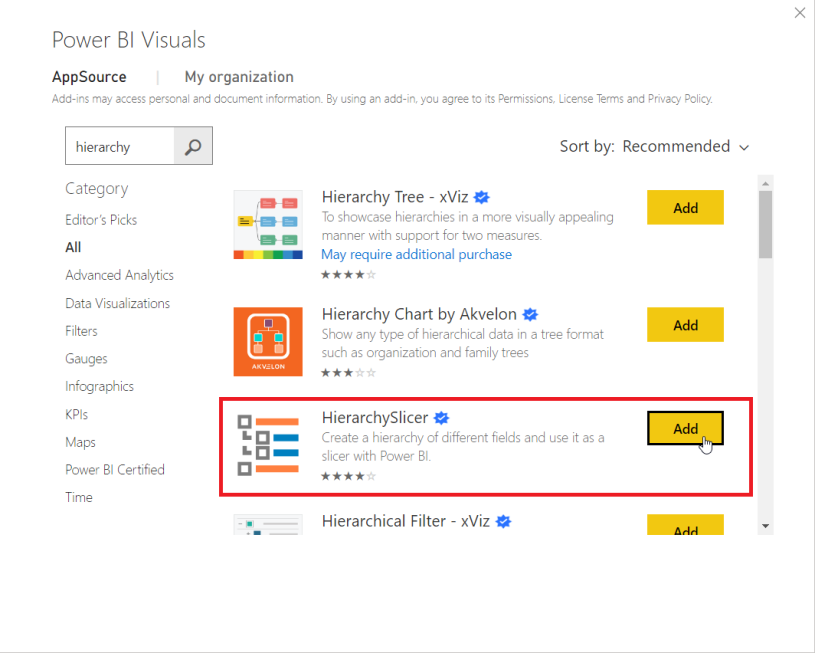
Step 02
The Power BI Visuals window will appear. Now, search for Hierarchy Slicer and click on Add.

Figure 5: Search for hierarchy slicer in Power BI Visuals and click on Add
This will take some time, once the visual is successfully imported to your Power BI Report, the following message will appear.
Figure 6: Once the visual is successfully imported
Now you can see the imported Hierarchy Slicer visual in the Visualizations Pane.
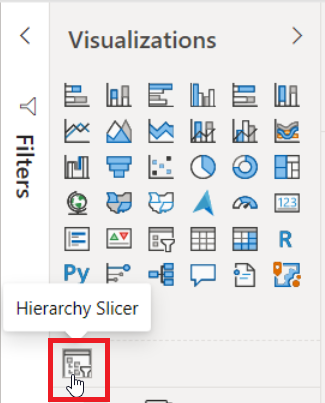
Figure 7: Now you can see the imported Hierarchy Slicer visual in the Visualizations Pane.
Step 03
Now click on the canvas and then click the imported visual to add it to the report. It appears as follow.
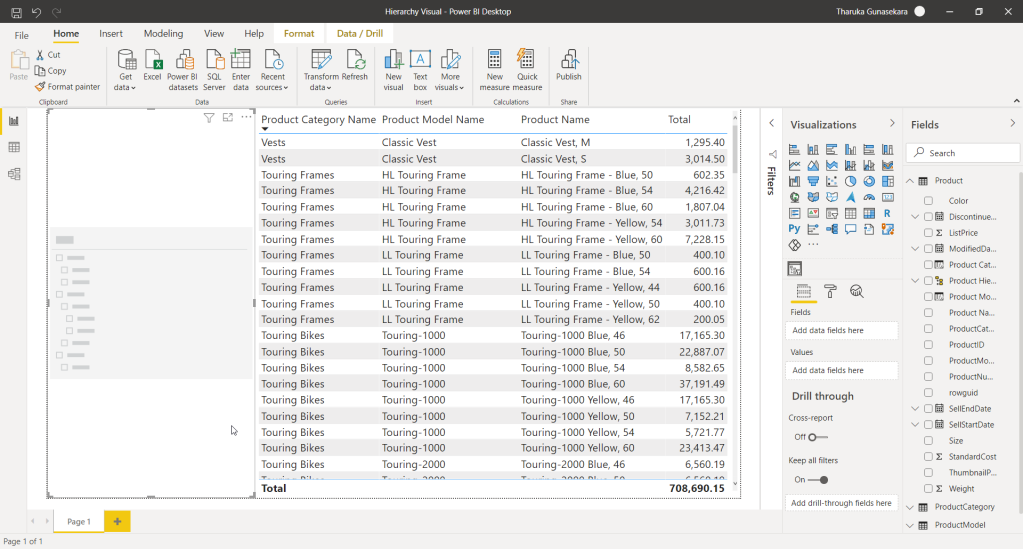
Figure 8: Hierarchy slicer initial view in the report
After that, drag and drop the created hierarchy to the Fields Area of the new visual.
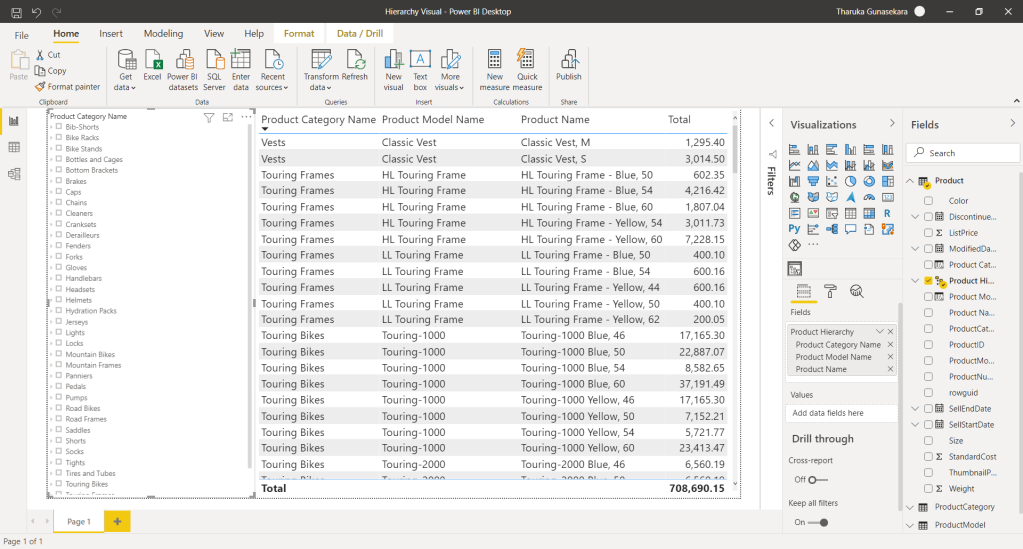
Figure 9: Hierarchy appears in the Report
Step 04
Now when I click on a particular category in the hierarchy slicer, the report returns me all the rows of that category instead of a particular row. And also we can see the total sales of a particular category as follow.
Figure 10: Filtering for a category using the Hierarchy Slicer
And if you expand the categories available in the Hierarchy Slicer, all the subcategories can be found. And if you want to filter for these subcategories all you must do is, select that subcategory from the slicer.
To get more insight, I added a column chart to the report as follow.